Market Outlook
December 02, 2016
Market Cues
Domestic Indices
Chg (%)
(Pts)
(Close)
Indian market is expected to open on a negative note tracking the SGX Nifty.
BSE Sensex
(0.3)
(93)
26,560
Nifty
(0.4)
(32)
8,193
The Dow Jones Industrial Average bucked the broader market’s weakness on
Thursday to close at a record high, even as large-cap technology stocks weighed
Mid Cap
(1.1)
(144)
12,355
down the Nasdaq Composite index for a second straight session. The Dow rose
Small Cap
(0.6)
(79)
12,250
0.4% to close at 19,192 after touching an intra-day high of 19,214. The data
Bankex
(1.2)
(248)
21,068
released in US was mixed but pointed to continued growth in the labor market and
manufacturing. The ISM manufacturing index rose to 53.2% in November from
Global Indices
Chg (%)
(Pts)
(Close)
51.9% in October. Meanwhile, Markit’s November final PMI index was at 54.1
compared with 53.4 in October.
Dow Jones
0.4
68
19,192
Nasdaq
(1.4)
(73)
5,251
A rising pound and worries about inflation picking up cut down U.K. markets on
Thursday, but energy companies continued to get a lift from OPEC’s deal to cut oil
FTSE
(0.5)
(31)
6,753
production. The FTSE 100 index fell 0.5% to close at 6,753, but gains for
Nikkei
(0.6)
(116)
18,397
commodity and financial shares helped the index to pare a potential loss of 1%.
Hang Seng
(0.9)
(210)
22,668
In a volatile trade yesterday, Indian benchmark indices pared gains to settle on a
Shanghai Com
(0.1)
(3)
3,270
lower note. The initial rally was dragged by telecom, banking and metal indices.
India’s GDP, announced yesterday, grew lower than expected in the September
Advances / Declines
BSE
NSE
quarter at 7.3% also affected the sentiment. After the gains the earlier sessions,
Advances
1,103
583
market turned to profit booking on the back of weak global cues and the prolonged
Declines
1,595
1,034
concern over domestic liquidity. While market is in consolidation, investors are
awaiting RBI’s monetary policy for taking further bet.
Unchanged
134
52
News Analysis
Volumes (` Cr)
Reliance Jio extends free offers in more pain for Airtel, Vodafone, Idea
BSE
2,776
Detailed analysis on Pg2
NSE
17,354
Investor’s Ready Reckoner
Key Domestic & Global Indicators
Net Inflows (` Cr)
Net
Mtd
Ytd
Stock Watch: Latest investment recommendations on 150+ stocks
FII
(653)
(17,377)
27,638
Refer Pg5 onwards
MFs
1,172
12,822
34,875
Top Picks
Top Gainers
Price (`)
Chg (%)
CMP
Target
Upside
Company
Sector
Rating
(`)
(`)
(%)
Hcc
41
19.9
Amara Raja BatteriesAuto & Auto Ancill.
Buy
944
1,167
23.6
Balkrisind
1,190
19.7
HCL Tech
IT
Buy
802
1,000
24.7
Mmtc
52
13.9
Asian Granito
Capital Goods
Buy
224
351
56.7
Equitas Holdings
Financials
Buy
162
235
45.5
Hathway
36
5.1
Navkar Corporation Others
Buy
176
265
50.9
Aban
247
4.0
More Top Picks on Pg3
Top Losers
Price (`)
Chg (%)
Key Upcoming Events
Previous
Consensus
Jklakshmi
386
(6.4)
Date
Region
Event Description
Reading
Expectations
Idea
73
(5.9)
Dec 2 US
Change in Nonfarm payrolls
161.00
180.00
Gspl
148
(5.7)
Dec 2 US
Unemployment rate
4.90
4.90
Dec 5 US
Unnemployment rate
4.90
4.90
Amtekauto
40
(5.4)
Dec 6 Germany PMI Services
55.00
Rcom
36
(5.1)
Dec 7 UK
Industrial Production (YoY)
0.30
As on December 01, 2016
More Events on Pg4
Market Outlook
December 02, 2016
News Analysis
Reliance Jio extends free offers in more pain for Airtel,
Vodafone, Idea
Yesterday Reliance Industries chairman, Mukesh Ambani, announced that Reliance
Jio will provide free voice calling, text messaging and data services until the end of
March-2017 under offer named as “Happy New Year” offer. This is extension of its
inaugural offer to attract more customers from.
Every new Jio user will get free access to Jio’s data, voice, video and the full
bouquet of Jio applications and content till 31st March 2017. The extension could
hit revenue growth in a telecom industry where intense competition has already
taken its toll. Rivals Bharti Airtel and Vodafone India have responded with sharp
tariff cuts to retain customers after Jio’s launch. In September quarter, Telecom
sector revenue growth slowed to 4.4% from 6.5% in the year-ago period,
according to Trai.
Ambani also announced home delivery of Jio SIM cards and making mobile
number portability easier for quicker sign-ups which indicates step-up in the
competition for the rivals.
Economic and Political News
Rate cut by RBI next week a near certainty, say economists
RBI Board recommended currency ban, Govt to SC
Note ban shadow over GST Bill
Government aims to boost India's weight in MSCI Emerging Markets Index
Corporate News
HC sets aside Centre's ban on 344 FDCs
Reliance Jio’s free data offer to march into next year
Jio move may hurt top three incumbents more
Auto sales ride past the potholes of currency purge
Market Outlook
December 02, 2016
Top Picks ★★★★★
Large Cap
Market Cap
CMP
Target
Upside
Company
Rationale
(` Cr)
(`)
(`)
(%)
To outpace battery industry growth due to better
Amara Raja Batteries
16,128
944
1,167
23.6
technological products leading to market share gains in both
the automotive OEM and replacement segments.
The stock is trading at attractive valuations and is factoring
HCL Tech
1,13,100
802
1,000
24.7
all the bad news.
Back on the growth trend; expect a long term growth of 14%
Infosys
2,24,193
976
1,249
27.9
to be a US$20bn in FY2020.
Strong growth in domestic business due to its leadership in
Alkem Laboratories
20,076
1,679
1,989
18.5
acute therapeutic segment. Alkem expects to launch more
products in USA, which bodes for its international business.
One of the largest pharma companies with strong
Lupin
68,223
1,513
1,809
19.5
international presence. It has a rich pipeline of ANDAs which
is also one of the largest among the generic companies.
Strong order backlog and improvement in execution would
Larsen & Tourbo
1,29,120
1,385
1,634
17.9
trigger the growth for the L&T
Going forward, we expect the company to report strong
Power Grid Corporation
96,471
184
223
20.9
top-line CAGR of ~16% and bottom-line CAGR of ~19%
over FY16-18 on back of strong capitalization guidance
Source: Company, Angel Research
Mid Cap
Market Cap
CMP
Target
Upside
Company
Rationale
(` Cr)
(`)
(`)
(%)
We expect the company would report strong profitability
Asian Granito
674
224
351
56.7
owing to better product mix, higher B2C sales and
amalgamation synergy.
Among the top 4 players in the consumer durables segment.
Bajaj Electricals
2,228
220
274
24.1
Improved profitability backed by turn around in E&P
segment. Strong order book lends earnings visibility.
Favourable outlook for AC industry augurs well for Cooling
Blue Star
4,634
486
634
30.5
products business which is outgrowing the market. EMPPAC
division's is likely to turn around on improving economy
With a focus on the low and medium income (LMI)
Dewan Housing Finance
7,783
249
350
40.8
consumer segment, the company has increased its presence
in tier-II & III cities where the growth opportunity is immense.
Strong loan growth backed by diversified loan portfolio and
adequate CAR. ROE & ROA likely to remain decent as risk of
Equitas Holdings
5,418
162
235
45.5
dilution remains low. Attractive valuations considering
growth.
Economic recovery to have favourable impact on advertising
& circulation revenue growth. Further, the acquisition of a
Jagran Prakashan
5,811
178
225
26.6
radio business (Radio City) would also boost the company's
revenue growth.
Speedier execution and speedier sales, strong revenue
Mahindra Lifespace
1,479
361
522
44.8
visibilty in short-to-long run, attractive valuations
We expect the company to report strong growth on back of
healthy growth in domestic branded sales (owing to
Mirza International
957
80
107
34.5
aggressive ad spend and addition in the number of EBOs &
multi-brand outlets [MBOs]) and healthy export revenues.
Massive capacity expansion along with rail advantage at
Navkar Corporation
2,505
176
265
50.9
ICD as well CFS augurs well for the company.
Strong brands and distribution network would boost growth
Siyaram Silk Mills
1,174
1,253
1,605
28.1
going ahead. Stock currently trades at an inexpensive
valuation.
Market leadership in Hindi news genre and no. 2 viewership
ranking in English news genre, exit from the radio business,
TV Today Network
1,887
316
385
21.7
and anticipated growth in ad spends by corporate to benefit
the stock.
Source: Company, Angel Research
Market Outlook
December 02, 2016
Key Upcoming Events
Global economic events release calendar
Bloomberg Data
Date
Time
Country
Event Description
Unit
Period
Last Reported
Estimated
Dec 02, 2016
7:00 PM
US
Change in Nonfarm payrolls
Thousands
Nov
161.00
180.00
3:30 PM Euro Zone
Euro-Zone GDP s.a. (QoQ)
% Change 3Q F
0.30
Dec 05, 2016
7:00 PM
US
Unnemployment rate
% Nov
4.90
4.90
Dec 06, 2016
2:25 PM
Germany
PMI Services
Value Nov F
55.00
Dec 07, 2016
3:00 PM
UK
Industrial Production (YoY)
% Change
Oct
0.30
2:30 PM
India
RBI Reverse Repo rate
% Dec 7
5.75
2:30 PM
India
RBI Repo rate
% Dec 7
6.25
2:30 PM
India
RBI Cash Reserve ratio
% Dec 7
4.00
Dec 08, 2016
China
Exports YoY%
% Change
Nov
(7.30)
(5.00)
6:15 PM Euro Zone
ECB announces interest rates
% Dec 8
-
Dec 09, 2016
India
Imports YoY%
% Change
Nov
8.10
India
Exports YoY%
% Change
Nov
9.59
7:00 AM
China
Consumer Price Index (YoY)
% Change
Nov
2.10
2.20
Dec 12, 2016
3:00 PM
UK
CPI (YoY)
% Change
Nov
0.90
Dec 13, 2016
5:30 PM
India
Industrial Production YoY
% Change
Oct
0.70
7:30 AM
China
Industrial Production (YoY)
% Change
Nov
6.10
6.10
Dec 14, 2016
3:00 PM
UK
Jobless claims change
% Change
Nov
9.80
7:45 PM
US
Industrial Production
% Nov
0.04
0.10
US
Producer Price Index (mom)
% Change
Nov
0.40
12:00 PM
India
Monthly Wholesale Prices YoY%
% Change
Nov
3.39
Dec 15, 2016
7:00 PM
US Consumer price index (mom)
% Change
Nov
0.40
5:30 PM
UK
BOE Announces rates
% Ratio
Dec 15
0.25
12:30 AM
US
FOMC rate decision
%
Dec 14
0.50
0.75
Dec 16, 2016
7:00 PM
US
Building permits
Thousands
Nov
1,260.00
3:30 PM Euro Zone
Euro-Zone CPI (YoY)
% Nov F
0.60
8:30 PM Euro Zone Euro-Zone Consumer Confidence
Value Dec A
(6.10)
Dec 21, 2016
7:00 PM
US
Housing Starts
Thousands
Nov
1,323.00
8:30 PM
US
Existing home sales
Million
Nov
5.60
Source: Bloomberg, Angel Research
Market Outlook
December 02, 2016
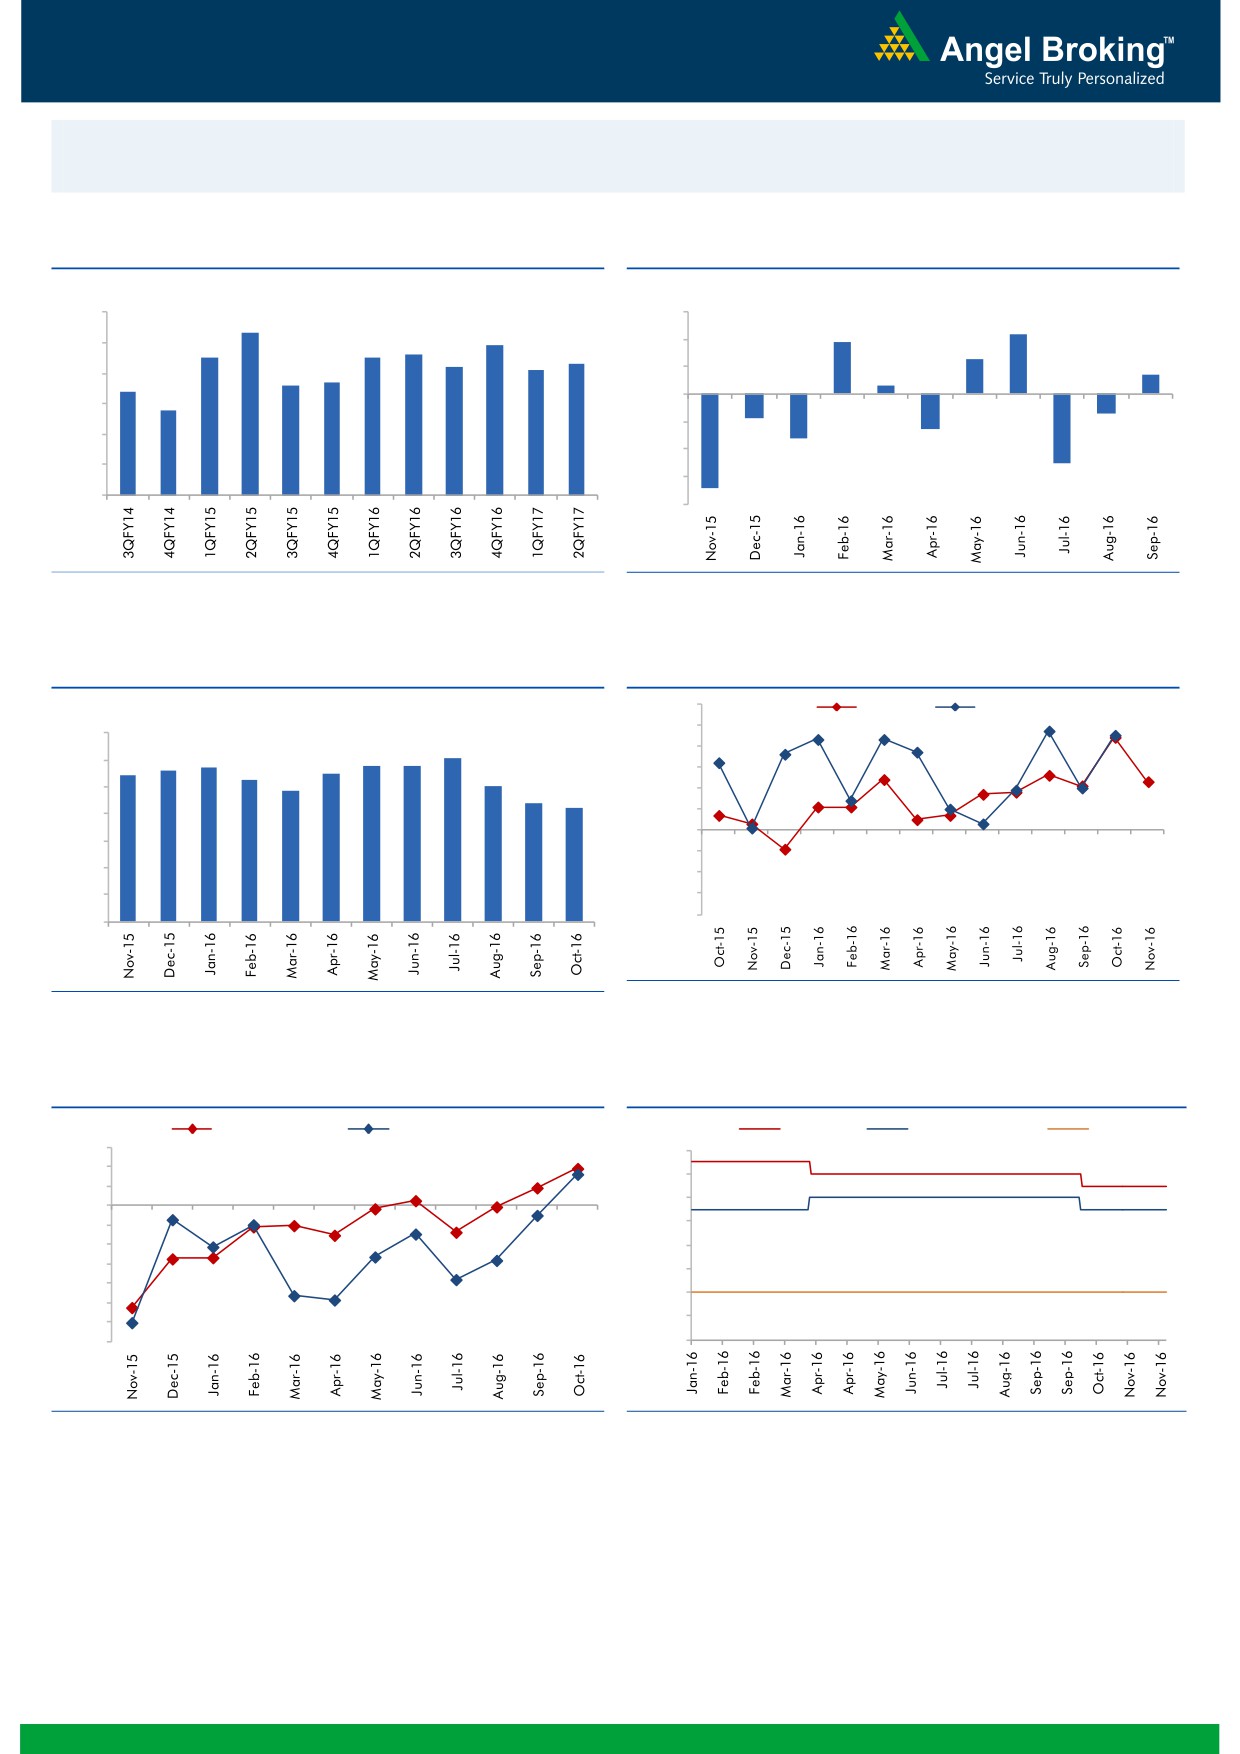
Macro watch
Exhibit 1: Quarterly GDP trends
Exhibit 2: IIP trends
(%)
(%)
9.0
3.0
8.3
2.2
7.9
1.9
8.0
7.5
7.5
7.6
2.0
1.3
7.2
7.1
7.3
0.7
6.6
6.7
1.0
0.3
7.0
6.4
5.8
-
6.0
(1.0)
5.0
(0.9)
(0.7)
(2.0)
(1.3)
(1.6)
4.0
(3.0)
(2.5)
3.0
(4.0)
(3.4)
Source: CSO, Angel Research
Source: MOSPI, Angel Research
Exhibit 3: Monthly CPI inflation trends
Exhibit 4: Manufacturing and services PMI
56.0
Mfg. PMI
Services PMI
(%)
55.0
7.0
6.1
5.7
5.8
5.8
54.0
5.6
5.5
6.0
5.4
5.3
5.1
53.0
4.8
5.0
4.4
52.0
4.2
51.0
4.0
50.0
3.0
49.0
2.0
48.0
1.0
47.0
46.0
-
Source: Market, Angel Research; Note: Level above 50 indicates expansion
Source: MOSPI, Angel Research
Exhibit 5: Exports and imports growth trends
Exhibit 6: Key policy rates
(%)
Exports yoy growth
Imports yoy growth
(%)
Repo rate
Reverse Repo rate
CRR
15.0
7.00
10.0
6.50
5.0
6.00
0.0
(5.0)
5.50
(10.0)
5.00
(15.0)
4.50
(20.0)
4.00
(25.0)
3.50
(30.0)
(35.0)
3.00
Source: Bloomberg, Angel Research
Source: RBI, Angel Research
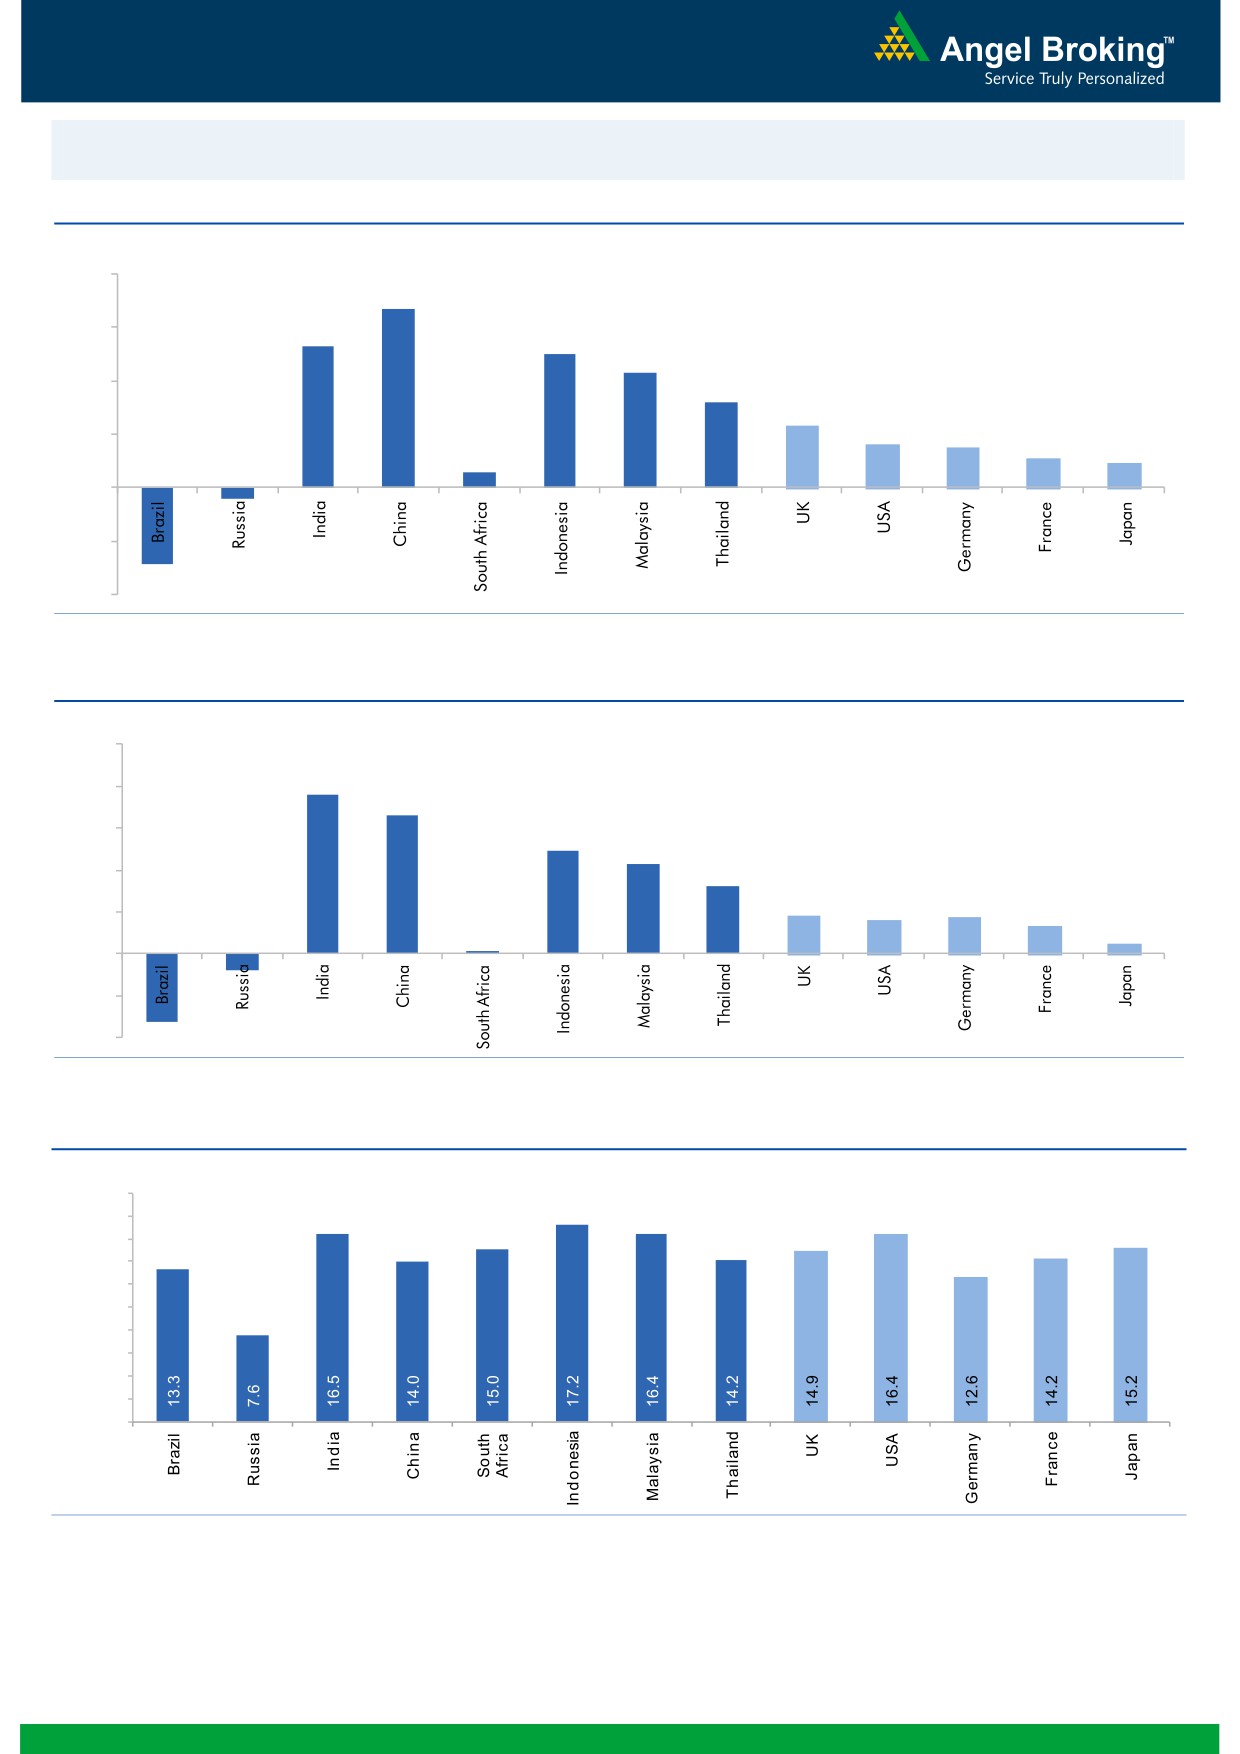
Market Outlook
December 02, 2016
Global watch
Exhibit 1: Latest quarterly GDP Growth (%, yoy) across select developing and developed countries
(%)
8.0
6.7
5.3
6.0
5.0
0.6
4.3
4.0
3.2
2.3
1.6
1.5
2.0
1.1
0.9
-
(2.0)
(0.4)
(2.9)
(4.0)
Source: Bloomberg, Angel Research
Exhibit 2: 2016 GDP Growth projection by IMF (%, yoy) across select developing and developed countries
(%)
10.0
7.6
8.0
6.6
6.0
4.9
4.3
4.0
3.2
1.8
1.7
1.6
1.3
2.0
(0.8)
0.5
(3.3)
0.1
-
(2.0)
(4.0)
Source: IMF, Angel Research
Exhibit 3: One year forward P-E ratio across select developing and developed countries
(x)
20.0
18.0
16.0
14.0
12.0
10.0
8.0
6.0
4.0
2.0
-
Source: IMF, Angel Research
Market Outlook
December 02, 2016
Exhibit 4: Relative performance of indices across globe
Returns (%)
Country
Name of index
Closing price
1M
3M
1YR
Brazil
Bovespa
59,507
(7.5)
1.5
26.2
Russia
Micex
2,122
6.6
7.3
19.7
India
Nifty
8,193
(5.0)
(4.4)
4.6
China
Shanghai Composite
3,273
5.4
6.6
(9.6)
South Africa
Top 40
43,412
(2.3)
(7.6)
(6.2)
Mexico
Mexbol
44,885
(6.5)
(5.8)
4.3
Indonesia
LQ45
870
(5.7)
(5.1)
11.7
Malaysia
KLCI
1,626
(2.7)
(3.3)
(3.4)
Thailand
SET 50
947
0.5
(3.2)
5.7
USA
Dow Jones
19,192
5.8
4.3
9.8
UK
FTSE
6,753
(2.4)
(2.1)
8.2
Japan
Nikkei
18,513
6.1
13.2
(6.9)
Germany
DAX
10,534
0.1
(0.0)
(2.0)
France
CAC
4,561
2.0
0.4
(1.6)
Source: Bloomberg, Angel Research
Stock Watch
December 02, 2016
Company Name
Reco
CMP
Target
Mkt Cap
Sales ( Čcr )
OPM(%)
EPS (Č)
PER(x)
P/BV(x)
RoE(%)
EV/Sales(x)
(Č)
Price ( Č)
( Č cr )
FY17E FY18E
FY17E
FY18E
FY17E
FY18E
FY17E
FY18E
FY17E
FY18E
FY17E
FY18E
FY17E
FY18E
Agri / Agri Chemical
Rallis
Neutral
201
-
3,915
1,937
2,164
13.3
14.3
9.0
11.0
22.4
18.3
3.9
3.4
18.4
19.8
2.1
1.8
United Phosphorus
Accumulate
650
684
32,957
15,176
17,604
18.5
18.5
37.4
44.6
17.4
14.6
3.4
2.8
21.4
21.2
2.3
1.9
Auto & Auto Ancillary
Ashok Leyland
Buy
78
111
22,098
22,407
26,022
10.6
10.6
5.2
6.4
14.9
12.1
3.4
2.8
23.6
24.7
1.1
0.9
Bajaj Auto
Neutral
2,685
-
77,699
25,093
27,891
19.5
19.2
143.9
162.5
18.7
16.5
5.2
4.5
30.3
29.4
2.8
2.5
Bharat Forge
Neutral
898
-
20,898
7,726
8,713
20.5
21.2
35.3
42.7
25.4
21.0
4.7
4.2
18.9
20.1
2.8
2.4
Eicher Motors
Neutral
22,202
-
60,304
16,583
20,447
17.5
18.0
598.0
745.2
37.1
29.8
12.7
9.7
41.2
38.3
3.5
2.7
Gabriel India
Buy
109
130
1,569
1,544
1,715
9.0
9.3
5.4
6.3
20.2
17.3
3.8
3.4
18.9
19.5
1.0
0.9
Hero Motocorp
Accumulate
3,178
3,541
63,468
30,958
34,139
15.7
15.7
193.6
208.3
16.4
15.3
6.4
5.3
34.2
30.5
1.9
1.7
Jamna Auto Industries Neutral
174
-
1,393
1,486
1,620
9.8
9.9
15.0
17.2
11.6
10.1
2.5
2.2
21.8
21.3
1.0
0.9
L G Balakrishnan & Bros Neutral
605
-
950
1,302
1,432
11.6
11.9
43.7
53.0
13.9
11.4
2.0
1.8
13.8
14.2
0.8
0.7
Mahindra and Mahindra Neutral
1,160
-
72,044
46,534
53,077
11.6
11.7
67.3
78.1
17.2
14.9
2.8
2.5
15.4
15.8
1.5
1.3
Maruti
Accumulate
5,249
6,006
158,569
68,057
82,958
15.8
15.5
212.1
261.2
24.8
20.1
4.9
4.1
19.8
20.3
2.0
1.6
Minda Industries
Neutral
304
-
2,410
2,728
3,042
9.0
9.1
68.2
86.2
4.5
3.5
1.0
0.8
23.8
24.3
0.9
0.8
Motherson Sumi
Neutral
311
-
43,659
45,896
53,687
7.8
8.3
13.0
16.1
23.9
19.3
7.7
6.1
34.7
35.4
1.0
0.9
Rane Brake Lining
Neutral
938
-
742
511
562
11.3
11.5
28.1
30.9
33.4
30.3
5.1
4.6
15.3
15.0
1.6
1.5
Setco Automotive
Neutral
38
-
509
741
837
13.0
13.0
15.2
17.0
2.5
2.2
0.4
0.4
15.8
16.3
1.1
1.0
Tata Motors
Neutral
448
-
129,390
300,209
338,549
8.9
8.4
42.7
54.3
10.5
8.3
1.7
1.4
15.6
17.2
0.5
0.5
TVS Motor
Neutral
368
-
17,469
13,390
15,948
6.9
7.1
12.8
16.5
28.8
22.2
7.2
5.7
26.3
27.2
1.3
1.1
Amara Raja Batteries
Buy
944
1,167
16,128
5,504
6,605
17.6
17.5
33.4
40.9
28.3
23.1
6.2
5.1
22.1
22.0
2.9
2.4
Exide Industries
Neutral
179
-
15,181
7,439
8,307
15.0
15.0
8.1
9.3
22.1
19.2
3.1
2.8
14.3
16.7
1.7
1.5
Apollo Tyres
Buy
188
235
9,572
12,877
14,504
14.3
13.9
21.4
23.0
8.8
8.2
1.4
1.2
16.4
15.2
0.9
0.8
Ceat
Buy
1,260
1,450
5,097
7,524
8,624
13.0
12.7
131.1
144.3
9.6
8.7
1.8
1.5
19.8
18.6
0.8
0.7
JK Tyres
Neutral
119
-
2,701
7,455
8,056
15.0
15.0
21.8
24.5
5.5
4.9
1.1
0.9
22.8
21.3
0.5
0.4
Swaraj Engines
Neutral
1,340
-
1,664
660
810
15.2
16.4
54.5
72.8
24.6
18.4
7.7
7.0
31.5
39.2
2.3
1.9
Subros
Neutral
166
-
995
1,488
1,681
11.7
11.9
6.4
7.2
25.9
23.1
2.7
2.5
10.8
11.4
0.9
0.8
Indag Rubber
Neutral
179
-
471
286
326
19.8
16.8
11.7
13.3
15.3
13.5
2.6
2.4
17.8
17.1
1.3
1.1
Capital Goods
ACE
Neutral
51
-
500
709
814
4.1
4.6
1.4
2.1
36.1
24.1
1.5
1.4
4.4
6.0
0.9
0.8
BEML
Neutral
832
-
3,466
3,451
4,055
6.3
9.2
31.4
57.9
26.5
14.4
1.6
1.4
6.3
10.9
1.1
0.9
Bharat Electronics
Neutral
1,434
-
32,028
8,137
9,169
16.8
17.2
58.7
62.5
24.4
22.9
3.8
3.4
44.6
46.3
2.9
2.6
Stock Watch
December 02, 2016
Company Name
Reco
CMP
Target
Mkt Cap
Sales ( Čcr )
OPM(%)
EPS (Č)
PER(x)
P/BV(x)
RoE(%)
EV/Sales(x)
(Č)
Price ( Č)
( Č cr )
FY17E
FY18E
FY17E
FY18E
FY17E
FY18E
FY17E
FY18E
FY17E
FY18E
FY17E
FY18E
FY17E
FY18E
Capital Goods
Voltas
Buy
308
407
10,185
6,511
7,514
7.9
8.7
12.9
16.3
23.9
18.9
4.3
3.8
16.7
18.5
1.3
1.1
BGR Energy
Neutral
111
-
803
16,567
33,848
6.0
5.6
7.8
5.9
14.3
18.9
0.8
0.8
4.7
4.2
0.2
0.1
BHEL
Neutral
129
-
31,525
28,797
34,742
-
2.8
2.3
6.9
56.0
18.7
1.0
0.9
1.3
4.8
0.7
0.5
Blue Star
Buy
486
634
4,634
4,283
5,077
5.9
7.3
14.9
22.1
32.7
22.0
6.3
5.3
20.4
26.4
1.1
0.9
Crompton Greaves
Neutral
77
-
4,795
5,777
6,120
5.9
7.0
3.3
4.5
23.2
17.0
1.0
1.0
4.4
5.9
0.8
0.7
Greaves Cotton
Neutral
129
-
3,150
1,755
1,881
16.8
16.9
7.8
8.5
16.5
15.2
3.3
3.1
20.6
20.9
1.5
1.3
Inox Wind
Neutral
186
-
4,122
5,605
6,267
15.7
16.4
24.8
30.0
7.5
6.2
2.1
1.5
25.9
24.4
0.8
0.6
KEC International
Neutral
143
-
3,676
9,294
10,186
7.9
8.1
9.9
11.9
14.4
12.0
2.1
1.8
15.6
16.3
0.6
0.6
Thermax
Neutral
830
-
9,889
5,421
5,940
7.3
7.3
25.7
30.2
32.3
27.5
3.9
3.6
12.2
13.1
1.7
1.6
VATech Wabag
Buy
503
681
2,743
3,136
3,845
8.9
9.1
26.0
35.9
19.4
14.0
2.4
2.1
13.4
15.9
0.8
0.6
Cement
ACC
Neutral
1,336
-
25,096
11,225
13,172
13.2
16.9
44.5
75.5
30.0
17.7
2.8
2.6
11.2
14.2
2.2
1.9
Ambuja Cements
Neutral
207
-
41,053
9,350
10,979
18.2
22.5
5.8
9.5
35.7
21.8
3.0
2.7
10.2
12.5
4.4
3.7
India Cements
Neutral
118
-
3,609
4,364
4,997
18.5
19.2
7.9
11.3
14.9
10.4
1.1
1.0
8.0
8.5
1.6
1.4
JK Cement
Neutral
733
-
5,124
4,398
5,173
15.5
17.5
31.2
55.5
23.5
13.2
2.8
2.4
12.0
15.5
1.7
1.4
J K Lakshmi Cement
Buy
386
565
4,539
2,913
3,412
14.5
19.5
7.5
22.5
51.4
17.1
3.2
2.7
12.5
18.0
2.1
1.8
Orient Cement
Buy
133
215
2,724
2,114
2,558
18.5
20.5
8.1
11.3
16.4
11.8
2.4
2.1
9.0
14.0
1.9
1.5
UltraTech Cement
Neutral
3,563
-
97,769
25,768
30,385
21.0
23.5
111.0
160.0
32.1
22.3
4.1
3.6
13.5
15.8
3.9
3.2
Construction
ITNL
Neutral
101
-
3,332
8,946
10,017
31.0
31.6
8.1
9.1
12.5
11.1
0.5
0.5
4.2
5.0
3.7
3.4
KNR Constructions
Accumulate
760
802
2,137
1,385
1,673
14.7
14.0
41.2
48.5
18.5
15.7
3.4
3.0
14.9
15.2
1.6
1.3
Larsen & Toubro
Buy
1,385
1,634
129,120
111,017
124,908
11.0
11.0
61.1
66.7
22.7
20.8
2.7
2.5
13.1
12.9
2.2
2.0
Gujarat Pipavav Port
Neutral
138
-
6,676
705
788
52.2
51.7
5.0
5.6
27.6
24.7
2.7
2.4
11.2
11.2
9.1
7.7
Nagarjuna Const.
Neutral
78
-
4,347
8,842
9,775
9.1
8.8
5.3
6.4
14.8
12.2
1.2
1.1
8.2
9.1
0.7
0.6
PNC Infratech
Buy
109
143
2,791
2,350
2,904
13.1
13.2
9.0
8.8
12.1
12.4
0.4
0.4
15.9
13.9
1.3
1.1
Simplex Infra
Neutral
302
-
1,494
6,829
7,954
10.5
10.5
31.4
37.4
9.6
8.1
1.0
0.9
9.9
13.4
0.6
0.5
Power Mech Projects
Neutral
458
-
673
1,801
2,219
12.7
14.6
72.1
113.9
6.4
4.0
1.2
1.0
16.8
11.9
0.4
0.3
Sadbhav Engineering
Accumulate
275
298
4,723
3,598
4,140
10.3
10.6
9.0
11.9
30.6
23.1
3.2
2.8
9.9
11.9
1.6
1.4
NBCC
Neutral
227
-
13,635
7,428
9,549
7.9
8.6
8.2
11.0
27.7
20.7
1.4
1.1
28.2
28.7
1.6
1.1
MEP Infra
Neutral
36
-
578
1,877
1,943
30.6
29.8
3.0
4.2
11.9
8.5
5.7
3.9
0.6
0.6
1.7
1.5
SIPL
Neutral
91
-
3,212
1,036
1,252
65.5
66.2
(8.4)
(5.6)
3.4
3.9
(22.8)
(15.9)
11.3
9.4
Stock Watch
December 02, 2016
Company Name
Reco
CMP
Target
Mkt Cap
Sales ( Čcr )
OPM(%)
EPS (Č)
PER(x)
P/BV(x)
RoE(%)
EV/Sales(x)
(Č)
Price ( Č)
( Č cr )
FY17E
FY18E
FY17E
FY18E
FY17E
FY18E
FY17E
FY18E
FY17E
FY18E
FY17E
FY18E
FY17E
FY18E
Construction
Engineers India
Neutral
299
-
10,088
1,725
1,935
16.0
19.1
11.4
13.9
26.3
21.5
3.6
3.5
13.4
15.3
4.8
4.3
Financials
Axis Bank
Buy
466
630
111,199
46,932
53,575
3.5
3.4
32.4
44.6
14.4
10.4
1.9
1.6
13.6
16.5
-
-
Bank of Baroda
Neutral
162
-
37,235
19,980
23,178
1.8
1.8
11.5
17.3
14.1
9.3
1.6
1.3
8.3
10.1
-
-
Canara Bank
Neutral
315
-
17,083
15,225
16,836
1.8
1.8
14.5
28.0
21.7
11.2
1.5
1.2
5.8
8.5
-
-
Dewan Housing Finance Buy
249
350
7,783
2,225
2,688
2.9
2.9
29.7
34.6
8.4
7.2
1.4
1.2
16.1
16.8
-
-
Equitas Holdings
Buy
162
235
5,418
939
1,281
11.7
11.5
5.8
8.2
27.9
19.7
2.4
2.1
10.9
11.5
-
-
Federal Bank
Neutral
69
-
11,916
9,353
10,623
2.9
2.9
4.4
5.8
15.8
12.0
1.5
1.3
9.5
11.0
-
-
HDFC
Neutral
1,270
-
200,775
11,475
13,450
3.4
3.4
45.3
52.5
28.0
24.2
5.4
4.8
20.2
20.5
-
-
HDFC Bank
Accumulate
1,196
1,350
302,809
46,097
55,433
4.5
4.5
58.4
68.0
20.5
17.6
3.6
3.0
18.8
18.6
-
-
ICICI Bank
Buy
259
315
150,920
42,800
44,686
3.1
3.3
18.0
21.9
14.4
11.8
2.0
1.8
11.1
12.3
-
-
Lakshmi Vilas Bank
Buy
149
174
2,675
3,339
3,799
2.7
2.8
11.0
14.0
13.6
10.7
1.4
1.3
11.2
12.7
-
-
LIC Housing Finance
Accumulate
571
630
28,806
3,712
4,293
2.6
2.5
39.0
46.0
14.6
12.4
2.8
2.4
19.9
20.1
-
-
Punjab Natl.Bank
Neutral
136
-
29,004
23,532
23,595
2.3
2.4
6.8
12.6
20.0
10.8
3.1
2.2
3.3
6.5
-
-
RBL Bank
Neutral
352
-
13,030
1,783
2,309
2.6
2.6
12.7
16.4
27.7
21.5
3.0
2.7
12.8
13.3
-
-
South Ind.Bank
Neutral
21
-
2,842
6,435
7,578
2.5
2.5
2.7
3.1
7.8
6.8
1.0
0.8
10.1
11.2
-
-
St Bk of India
Neutral
256
-
198,533
88,650
98,335
2.6
2.6
13.5
18.8
18.9
13.6
1.8
1.6
7.0
8.5
-
-
Union Bank
Neutral
148
-
10,140
13,450
14,925
2.3
2.3
25.5
34.5
5.8
4.3
0.8
0.7
7.5
10.2
-
-
Yes Bank
Neutral
1,162
-
48,903
8,978
11,281
3.3
3.4
74.0
90.0
15.7
12.9
3.0
2.5
17.0
17.2
-
-
FMCG
Asian Paints
Neutral
939
-
90,073
17,128
18,978
16.8
16.4
19.1
20.7
49.2
45.4
17.1
16.1
34.8
35.5
5.2
4.7
Britannia
Buy
3,002
3,626
36,021
9,594
11,011
14.6
14.9
80.3
94.0
37.4
31.9
15.4
11.9
41.2
-
3.6
3.1
Colgate
Accumulate
931
995
25,321
4,605
5,149
23.4
23.4
23.8
26.9
39.1
34.6
21.7
16.9
64.8
66.8
5.4
4.8
Dabur India
Accumulate
286
304
50,259
8,315
9,405
19.8
20.7
8.1
9.2
35.3
31.1
9.8
8.1
31.6
31.0
5.7
5.0
GlaxoSmith Con*
Neutral
5,142
-
21,623
4,350
4,823
21.2
21.4
179.2
196.5
28.7
26.2
7.6
6.5
27.1
26.8
4.4
3.8
Godrej Consumer
Neutral
1,497
-
50,978
10,235
11,428
18.4
18.6
41.1
44.2
36.4
33.9
8.1
6.8
24.9
24.8
5.1
4.5
HUL
Neutral
846
-
183,117
35,252
38,495
17.8
17.8
20.7
22.4
41.0
37.8
39.2
33.6
95.6
88.9
5.0
4.6
ITC
Buy
233
284
281,672
40,059
44,439
38.3
39.2
9.0
10.1
26.0
23.0
7.3
6.3
27.8
27.5
6.5
5.9
Marico
Buy
255
300
32,912
6,430
7,349
18.8
19.5
6.4
7.7
39.9
33.1
12.0
10.1
33.2
32.5
4.9
4.3
Nestle*
Neutral
6,281
-
60,559
10,073
11,807
20.7
21.5
124.8
154.2
50.3
40.7
20.7
18.6
34.8
36.7
5.8
4.9
Tata Global
Neutral
122
-
7,693
8,675
9,088
9.8
9.8
7.4
8.2
16.5
14.9
1.9
1.8
7.9
8.1
0.8
0.8
Stock Watch
December 02, 2016
Company Name
Reco
CMP
Target
Mkt Cap
Sales ( Čcr )
OPM(%)
EPS (Č)
PER(x)
P/BV(x)
RoE(%)
EV/Sales(x)
(Č)
Price ( Č)
( Č cr )
FY17E FY18E
FY17E
FY18E
FY17E
FY18E
FY17E
FY18E
FY17E
FY18E
FY17E
FY18E
FY17E
FY18E
FMCG
Procter & Gamble
Accumulate
6,596
7,369
21,411
2,939
3,342
23.2
23.0
146.2
163.7
45.1
40.3
101.0
96.9
25.3
23.5
6.8
5.9
Hygiene
IT
HCL Tech^
Buy
802
1,000
113,100
49,242
57,168
20.5
20.5
55.7
64.1
14.4
12.5
2.9
2.2
20.3
17.9
2.2
1.7
Infosys
Buy
976
1,249
224,193
68,350
77,326
27.0
27.0
62.5
69.4
15.6
14.1
3.3
3.0
21.3
21.6
2.7
2.4
TCS
Buy
2,266
2,620
446,588
119,025
133,308
27.6
27.6
131.2
145.5
17.3
15.6
5.6
5.2
32.4
33.1
3.5
3.1
Tech Mahindra
Buy
475
600
46,133
29,673
32,937
15.5
17.0
32.8
39.9
14.5
11.9
2.8
2.5
19.6
20.7
1.3
1.1
Wipro
Buy
468
590
113,673
55,440
60,430
18.1
18.1
35.9
39.9
13.0
11.7
2.3
2.1
19.0
19.3
1.8
1.6
Media
D B Corp
Neutral
364
-
6,690
2,297
2,590
27.4
28.2
21.0
23.4
17.3
15.6
4.0
3.5
23.7
23.1
2.7
2.3
HT Media
Neutral
71
-
1,650
2,693
2,991
12.6
12.9
7.9
9.0
9.0
7.9
0.8
0.7
7.8
8.3
0.2
0.1
Jagran Prakashan
Buy
178
225
5,811
2,355
2,635
28.0
28.0
10.8
12.5
16.5
14.2
3.6
3.1
21.7
21.7
2.5
2.2
Sun TV Network
Neutral
461
-
18,157
2,850
3,265
70.1
71.0
26.2
30.4
17.6
15.2
4.5
4.0
24.3
25.6
6.0
5.1
Hindustan Media
Neutral
274
-
2,007
1,016
1,138
24.3
25.2
27.3
30.1
10.0
9.1
1.9
1.7
16.2
15.8
1.3
1.1
Ventures
TV Today Network
Buy
316
385
1,887
637
743
27.5
27.5
18.4
21.4
17.2
14.8
3.0
2.6
17.4
17.2
2.6
2.1
Metals & Mining
Coal India
Neutral
306
-
193,565
84,638
94,297
21.4
22.3
24.5
27.1
12.5
11.3
5.2
5.0
42.6
46.0
1.8
1.6
Hind. Zinc
Neutral
275
-
116,133
14,252
18,465
55.9
48.3
15.8
21.5
17.4
12.8
2.8
2.5
17.0
20.7
8.2
6.3
Hindalco
Neutral
171
-
35,394
107,899
112,095
7.4
8.2
9.2
13.0
18.6
13.2
0.9
0.9
4.8
6.6
0.9
0.8
JSW Steel
Neutral
1,676
-
40,509
53,201
58,779
16.1
16.2
130.6
153.7
12.8
10.9
1.7
1.5
14.0
14.4
1.5
1.3
NMDC
Neutral
118
-
37,239
6,643
7,284
44.4
47.7
7.1
7.7
16.6
15.3
1.4
1.4
8.8
9.2
3.4
3.0
SAIL
Neutral
51
-
20,940
47,528
53,738
(0.7)
2.1
(1.9)
2.6
19.5
0.6
0.5
(1.6)
3.9
1.3
1.2
Vedanta
Neutral
227
-
67,269
71,744
81,944
19.2
21.7
13.4
20.1
16.9
11.3
1.5
1.3
8.4
11.3
1.3
1.0
Tata Steel
Neutral
410
-
39,791
121,374
121,856
7.2
8.4
18.6
34.3
22.0
11.9
1.4
1.3
6.1
10.1
1.0
0.9
Oil & Gas
Cairn India
Neutral
250
-
46,778
9,127
10,632
4.3
20.6
8.8
11.7
28.4
21.3
0.9
0.9
3.3
4.2
6.6
5.5
GAIL
Neutral
439
-
55,743
56,220
65,198
9.3
10.1
27.1
33.3
16.2
13.2
1.5
1.4
9.3
10.7
1.2
1.0
ONGC
Neutral
292
-
249,991
137,222
152,563
15.0
21.8
19.5
24.1
15.0
12.1
1.3
1.2
8.5
10.1
2.1
1.9
Indian Oil Corp
Neutral
298
-
144,633
373,359
428,656
5.9
5.5
54.0
59.3
5.5
5.0
0.9
0.8
16.0
15.6
0.5
0.5
Reliance Industries
Neutral
997
-
323,337
301,963
358,039
12.1
12.6
87.7
101.7
11.4
9.8
1.2
1.1
10.7
11.3
1.5
1.3
Pharmaceuticals
Alembic Pharma
Neutral
650
-
12,252
3,483
4,083
20.2
21.4
24.3
30.4
26.7
21.4
6.1
4.9
25.5
25.3
3.5
2.9
Alkem Laboratories Ltd
Buy
1,679
1,989
20,076
6,043
6,893
18.7
19.3
80.5
88.8
20.9
18.9
4.7
3.8
22.3
20.3
3.3
2.8
Aurobindo Pharma
Buy
744
877
43,507
15,720
18,078
23.7
23.7
41.4
47.3
18.0
15.7
4.7
3.7
29.6
26.1
3.0
2.6
Aventis*
Neutral
4,306
-
9,916
2,277
2,597
17.3
18.3
149.4
172.0
28.8
25.0
4.8
3.9
25.1
28.8
4.0
3.3
Stock Watch
December 02, 2016
Company Name
Reco
CMP
Target
Mkt Cap
Sales ( Čcr )
OPM(%)
EPS (Č)
PER(x)
P/BV(x)
RoE(%)
EV/Sales(x)
(Č)
Price ( Č)
( Č cr )
FY17E FY18E
FY17E
FY18E
FY17E
FY18E
FY17E
FY18E
FY17E
FY18E
FY17E
FY18E
FY17E
FY18E
Pharmaceuticals
Cadila Healthcare
Neutral
400
-
40,909
10,429
12,318
22.6
22.0
16.9
19.2
23.6
20.8
6.0
4.8
28.5
25.7
3.9
3.2
Cipla
Reduce
568
490
45,655
15,378
18,089
17.4
18.4
21.6
27.2
26.3
20.9
3.4
3.0
13.7
15.2
3.2
2.6
Dr Reddy's
Neutral
3,240
-
53,693
16,043
18,119
20.8
22.4
112.4
142.9
28.8
22.7
3.9
3.4
14.1
15.9
3.3
2.9
Dishman Pharma
Neutral
242
-
3,903
1,718
1,890
22.7
22.8
9.5
11.3
25.5
21.4
2.5
2.2
10.1
10.9
2.7
2.4
GSK Pharma*
Neutral
2,688
-
22,770
3,000
3,312
15.4
20.6
46.5
60.8
57.8
44.2
13.9
13.8
26.3
30.6
7.3
6.7
Indoco Remedies
Reduce
264
240
2,429
1,112
1,289
16.2
18.2
11.6
16.0
22.7
16.5
3.6
3.1
17.0
20.1
2.3
1.9
Ipca labs
Accumulate
572
613
7,212
3,303
3,799
15.3
15.3
17.3
19.7
33.0
29.0
2.9
2.6
9.1
9.4
2.3
2.0
Lupin
Buy
1,513
1,809
68,223
15,912
18,644
26.4
26.7
58.1
69.3
26.1
21.8
5.1
4.2
21.4
20.9
4.4
3.6
Sun Pharma
Buy
722
847
173,715
31,129
35,258
32.0
32.9
30.2
35.3
23.9
20.5
3.9
3.2
20.0
20.1
5.2
4.3
Power
Tata Power
Neutral
73
-
19,703
36,916
39,557
17.4
27.1
5.1
6.3
14.3
11.6
1.3
1.2
9.0
10.3
1.5
1.4
NTPC
Neutral
162
-
133,247
86,605
95,545
17.5
20.8
11.8
13.4
13.7
12.1
1.4
1.3
10.5
11.1
2.9
2.9
Power Grid
Buy
184
223
96,471
25,315
29,193
88.2
88.7
14.2
17.2
13.0
10.7
2.0
1.7
15.2
16.1
8.5
7.6
Real Estate
Prestige Estate
Buy
151
210
5,663
4,707
5,105
25.2
26.0
10.3
13.0
14.7
11.6
1.2
1.1
10.3
10.2
2.4
2.1
MLIFE
Buy
361
522
1,479
1,152
1,300
22.7
24.6
29.9
35.8
12.1
10.1
0.9
0.8
7.6
8.6
2.0
1.7
Telecom
Bharti Airtel
Neutral
319
-
127,557
105,086
114,808
34.5
34.7
12.2
16.4
26.2
19.5
1.8
1.7
6.8
8.4
2.1
1.8
Idea Cellular
Neutral
73
-
26,268
40,133
43,731
37.2
37.1
6.4
6.5
11.4
11.2
1.0
0.9
8.2
7.6
1.7
1.4
zOthers
Abbott India
Neutral
4,846
-
10,297
3,153
3,583
14.1
14.4
152.2
182.7
31.8
26.5
156.3
133.5
25.6
26.1
3.0
2.6
Asian Granito
Buy
224
351
674
1,071
1,182
12.1
12.4
12.7
16.0
17.6
14.0
1.7
1.5
9.5
10.7
0.9
0.8
Bajaj Electricals
Buy
220
274
2,228
4,801
5,351
5.7
6.2
10.4
13.7
21.2
16.1
2.6
2.3
12.4
14.5
0.5
0.4
Banco Products (India)
Neutral
192
-
1,371
1,353
1,471
12.3
12.4
14.5
16.3
13.2
11.8
18.3
16.5
14.5
14.6
1.0
102.1
Coffee Day Enterprises
Neutral
206
-
4,253
2,964
3,260
20.5
21.2
4.7
8.0
-
25.8
2.4
2.2
5.5
8.5
1.8
1.6
Ltd
Competent Automobiles Neutral
159
-
98
1,137
1,256
3.1
2.7
28.0
23.6
5.7
6.7
30.6
27.6
14.3
11.5
0.1
0.1
Elecon Engineering
Neutral
54
-
588
1,482
1,660
13.7
14.5
3.9
5.8
13.9
9.3
3.3
3.0
7.8
10.9
0.7
0.6
Finolex Cables
Neutral
413
-
6,310
2,883
3,115
12.0
12.1
14.2
18.6
29.1
22.2
15.5
13.5
15.8
14.6
1.9
1.7
Garware Wall Ropes
Neutral
629
-
1,376
873
938
14.3
14.3
35.2
37.5
17.9
16.8
3.1
2.7
17.5
15.9
1.5
1.4
Goodyear India*
Neutral
737
-
1,701
1,598
1,704
10.4
10.2
49.4
52.6
14.9
14.0
68.9
60.4
18.2
17.0
0.8
104.6
Hitachi
Neutral
1,410
-
3,834
2,081
2,433
8.8
8.9
33.4
39.9
42.2
35.3
34.1
28.4
22.1
21.4
1.8
1.5
HSIL
Neutral
290
-
2,097
2,384
2,515
15.8
16.3
15.3
19.4
19.0
15.0
18.8
16.2
7.8
9.3
1.0
1.0
Interglobe Aviation
Neutral
839
-
30,218
21,122
26,005
14.5
27.6
110.7
132.1
7.6
6.4
45.3
32.4
168.5
201.1
1.4
1.1
Stock Watch
December 02, 2016
Company Name
Reco
CMP
Target
Mkt Cap
Sales ( Čcr )
OPM(%)
EPS (Č)
PER(x)
P/BV(x)
RoE(%)
EV/Sales(x)
(Č)
Price ( Č)
( Č cr )
FY17E
FY18E
FY17E
FY18E
FY17E
FY18E
FY17E
FY18E
FY17E
FY18E
FY17E
FY18E
FY17E
FY18E
zOthers
Jyothy Laboratories
Neutral
355
-
6,450
1,440
2,052
11.5
13.0
8.5
10.0
41.8
35.5
10.1
9.4
18.6
19.3
4.8
3.3
Kirloskar Engines India
Neutral
330
-
4,769
2,554
2,800
9.9
10.0
10.5
12.1
31.4
27.3
13.1
12.4
10.7
11.7
1.5
1.3
Ltd
Linc Pen & Plastics
Neutral
234
-
346
382
420
9.3
9.5
13.5
15.7
17.4
14.9
3.0
2.6
17.1
17.3
1.0
0.9
M M Forgings
Neutral
424
-
512
546
608
20.4
20.7
41.3
48.7
10.3
8.7
58.1
51.4
16.6
17.0
0.8
0.7
Manpasand Bever.
Neutral
620
-
3,547
836
1,087
19.6
19.4
16.9
23.8
36.7
26.0
4.4
3.9
12.0
14.8
4.0
3.0
Mirza International
Buy
80
107
957
987
1,106
18.0
18.0
6.5
7.6
12.2
10.4
2.0
1.7
15.9
15.7
1.2
1.0
MT Educare
Neutral
115
-
459
366
417
17.7
18.2
9.4
10.8
12.3
10.7
2.7
2.4
22.2
22.3
1.2
1.0
Narayana Hrudaya
Neutral
344
-
7,036
1,873
2,166
11.5
11.7
2.6
4.0
130.2
86.8
8.0
7.2
6.1
8.3
3.9
3.3
Navkar Corporation
Buy
176
265
2,505
369
561
42.9
42.3
7.2
11.5
24.3
15.3
1.8
1.6
7.4
10.5
7.8
5.1
Navneet Education
Neutral
110
-
2,620
1,062
1,147
24.0
24.0
6.1
6.6
18.1
16.6
3.7
3.3
20.6
19.8
2.5
2.4
Nilkamal
Neutral
1,403
-
2,093
1,995
2,165
10.7
10.4
69.8
80.6
20.1
17.4
80.1
69.6
16.6
16.5
1.0
0.9
Page Industries
Neutral
13,031
-
14,535
2,450
3,124
20.1
17.6
299.0
310.0
43.6
42.0
290.2
221.6
47.1
87.5
6.0
4.7
Parag Milk Foods
Neutral
263
-
2,213
1,919
2,231
9.3
9.6
9.5
12.9
27.9
20.3
4.3
3.6
15.5
17.5
1.3
1.1
Quick Heal
Neutral
228
-
1,595
408
495
27.3
27.0
7.7
8.8
29.4
25.9
2.7
2.7
9.3
10.6
3.1
2.5
Radico Khaitan
Buy
123
147
1,632
1,667
1,824
13.0
13.2
6.7
8.2
18.5
15.0
1.7
1.5
9.0
10.2
1.4
1.2
Relaxo Footwears
Neutral
420
-
5,037
2,085
2,469
9.2
8.2
7.6
8.0
55.5
52.8
21.5
18.4
17.9
18.8
2.5
2.1
S H Kelkar & Co.
Neutral
292
-
4,218
1,036
1,160
15.1
15.0
6.1
7.2
47.8
40.6
5.1
4.7
10.7
11.5
3.9
3.5
Siyaram Silk Mills
Accumulate
1,253
1,605
1,174
1,733
1,948
11.6
11.7
96.6
114.7
13.0
10.9
2.0
1.7
15.3
15.7
0.9
0.8
Styrolution ABS India*
Neutral
595
-
1,046
1,440
1,537
9.2
9.0
40.6
42.6
14.7
14.0
37.4
34.0
12.3
11.6
0.7
0.6
Surya Roshni
Neutral
208
-
912
3,342
3,625
7.8
7.5
17.3
19.8
12.1
10.5
22.9
18.4
10.5
10.8
0.5
0.5
Team Lease Serv.
Neutral
857
-
1,465
3,229
4,001
1.5
1.8
22.8
32.8
37.6
26.1
4.0
3.5
10.7
13.4
0.4
0.3
The Byke Hospitality
Neutral
170
-
683
287
384
20.5
20.5
7.6
10.7
22.4
15.9
4.7
3.8
20.7
23.5
2.4
1.8
Transport Corporation of
Neutral
173
-
1,325
2,671
2,911
8.5
8.8
13.9
15.7
12.5
11.1
1.7
1.5
13.7
13.8
0.6
0.6
India
TVS Srichakra
Neutral
3,399
-
2,603
2,304
2,614
13.7
13.8
231.1
266.6
14.7
12.8
381.9
300.7
33.9
29.3
1.1
1.0
UFO Moviez
Neutral
445
-
1,228
619
685
33.2
33.4
30.0
34.9
14.9
12.8
2.1
1.8
13.8
13.9
1.7
1.3
Visaka Industries
Neutral
196
-
312
1,051
1,138
10.3
10.4
21.0
23.1
9.4
8.5
25.2
23.6
9.0
9.2
0.6
0.5
VRL Logistics
Neutral
274
-
2,499
1,902
2,119
16.7
16.6
14.6
16.8
18.8
16.3
4.1
3.6
21.9
22.2
1.4
1.3
Wonderla Holidays
Neutral
334
-
1,890
287
355
38.0
40.0
11.3
14.2
29.6
23.6
4.2
3.7
21.4
23.9
6.3
5.1
Source: Company, Angel Research; Note: *December year end; #September year end; &October year end; Price as on December 01, 2016
Market Outlook
December 02, 2016
Research Team Tel: 022 - 39357800
DISCLAIMER
Angel Broking Private Limited (hereinafter referred to as “Angel”) is a registered Member of National Stock Exchange of India
Limited,Bombay Stock Exchange Limited and Metropolitan Stock Exchange Limited. It is also registered as a Depository Participant with
CDSL and Portfolio Manager with SEBI. It also has registration with AMFI as a Mutual Fund Distributor. Angel Broking Private Limited is a
registered entity with SEBI for Research Analyst in terms of SEBI (Research Analyst) Regulations, 2014 vide registration number
INH000000164. Angel or its associates has not been debarred/ suspended by SEBI or any other regulatory authority for accessing
/dealing in securities Market. Angel or its associates/analyst has not received any compensation / managed or
co-managed public offering of securities of the company covered by Analyst during the past twelve months.
This document is solely for the personal information of the recipient, and must not be singularly used as the basis of any investment
decision. Nothing in this document should be construed as investment or financial advice. Each recipient of this document should make
such investigations as they deem necessary to arrive at an independent evaluation of an investment in the securities of the companies
referred to in this document (including the merits and risks involved), and should consult their own advisors to determine the merits and
risks of such an investment.
Reports based on technical and derivative analysis center on studying charts of a stock's price movement, outstanding positions and
trading volume, as opposed to focusing on a company's fundamentals and, as such, may not match with a report on a company's
fundamentals. Investors are advised to refer the Fundamental and Technical Research Reports available on our website to evaluate the
contrary view, if any.
The information in this document has been printed on the basis of publicly available information, internal data and other reliable
sources believed to be true, but we do not represent that it is accurate or complete and it should not be relied on as such, as this
document is for general guidance only. Angel Broking Pvt. Limited or any of its affiliates/ group companies shall not be in any way
responsible for any loss or damage that may arise to any person from any inadvertent error in the information contained in this report.
Angel Broking Pvt. Limited has not independently verified all the information contained within this document. Accordingly, we cannot
testify, nor make any representation or warranty, express or implied, to the accuracy, contents or data contained within this document.
While Angel Broking Pvt. Limited endeavors to update on a reasonable basis the information discussed in this material, there may be
regulatory, compliance, or other reasons that prevent us from doing so.
This document is being supplied to you solely for your information, and its contents, information or data may not be reproduced,
redistributed or passed on, directly or indirectly.
Neither Angel Broking Pvt. Limited, nor its directors, employees or affiliates shall be liable for any loss or damage that may arise from
or in connection with the use of this information.